
Manipulating data components
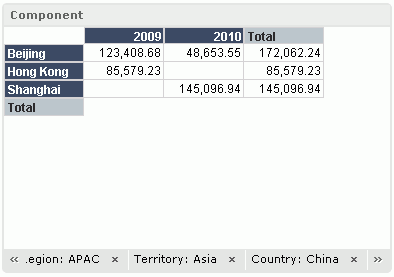
You can manipulate data components, which refer to crosstabs, tables, charts, and Google maps, in dashboards as shown below.
Applying a style to a data component
Right-click in the component, then on the shortcut menu, select a style from the Apply Style submenu.
Going through the data of tables, crosstabs and charts
Going actions enable you to switch among data groups freely for viewing different records without having to create a new data component. Choose the proper one to meet your needs from the following:
- Go-to
Jumps to a different group by replacing the current. It is performed on crosstab column/row headers and table groups.
- Go-to-by-value
Jumps to another group while applying the current value being clicked on as a filter condition. It is performed on crosstab column/row headers and table groups.
- Go-down
Goes from a group which is non-bottom level in a predefined hierarchy to the one-level-lower group while applying the current selected value as a filter condition. Go-down is performed on table groups, crosstab column/row headers, and chart categories and series.
- Go-up
Jumps from a group which is non-top level in a predefined hierarchy to the one-level-higher group. It is performed on table groups, crosstab column/row headers, and chart categories and series.
For example demonstration of them, refer to Going through the report data.
The go-to-by-value or go-down actions always happen along with the generation of a filter condition. The filters are displayed as "FieldName:Value" at the bottom of the library components, in a row one by one from left to right according to the time they are generated. When the row cannot hold all of the filters, two buttons are displayed at the two ends of the row for scrolling through the filters to the left and right. Each click on the button will show one hidden filter. To remove a filter condition, click X right to it.

Removing component level filters from a data component
On the shortcut menu of data components, there is an option Remove Filters which is used to remove filter conditions generated via the configuration panel and via message delivery from the data components. These two kinds of filters are referred to as component-level filters.
In dashboards you can also use sliders and filter controls to do filtering, however filters created by sliders or filter controls are not under the control of the removing component level filter action, because they are regarded as dashboard-level filters.
Going up/down on Google map group markers
- For the group level that is higher than some other group levels in a Google map component, point to its group marker, right-click it and select Go Down from the shortcut menu to jump one group level down.
- For the group level that is lower than some other group levels in a Google map component, point to its group marker, right-click it and select Go Up from the shortcut menu to jump one group level up.
Manipulating a table
- Sorting on a field
To sort the values of a field, right-click on any value of the field, then on the shortcut menu, select Ascend or Descend from the Sort submenu. To remove the sort condition, select No Sort.
- Filtering a detail field
You can use filter-related commands on the shortcut menu to filter the data in a table. To do this, right-click on any value of the field by which you want to filter data, then from the Filter submenu, specify to show the first/last N values of the field or a specific value. To remove filter condition created this way, use the Remove Filter option on the Filter submenu.
Manipulating a chart
- Sorting category/series labels
You can sort the labels on the category or series axes of a chart in either descending or ascending alphabetical order. To do this, right-click in the chart, then on the shortcut menu, select the required order from the Sort Category or Sort Series submenu.
- Swapping chart groups
You can switch data between the category and series axes, or between the category and value axes of a chart if no field on the series axes. To do this, right-click in the chart, then on the shortcut menu, click Swap Chart Groups.
- Changing chart type
Right-click in the chart, then on the shortcut menu, locate the Chart Type. From the drop-down menu, select the desired chart type and its subtype.


